You’ve got Grafana dashboards. PMM is collecting metrics. Datadog has agents on every host. CloudWatch alarms are set up. You know your CPU is at 34%, your queries per second are healthy, and your replication lag is under a second.
Then someone from support asks: “A customer says their plan changed from pro to free. When did that happen? Who did it?”
And you stare at your dashboards. Nothing there will help you.
The gap nobody talks about
Monitoring tools are designed to answer one question: how is my database doing right now? They’re great at it. CPU usage, InnoDB buffer pool hit ratio, threads connected, slow queries, replication delay. All important stuff.
But there’s a completely different question that comes up just as often: what happened to my data?
These are not the same question. Not even close.
“How is my database doing” is about infrastructure. “What happened to my data” is about rows. Actual rows, with actual values, that changed at a specific time. Your monitoring stack has zero visibility into this. Datadog can tell you that writes per second spiked at 3pm. It can’t tell you which rows were affected or what the values were before.
Think about the questions you get at work. Not the ones about performance. The other ones:
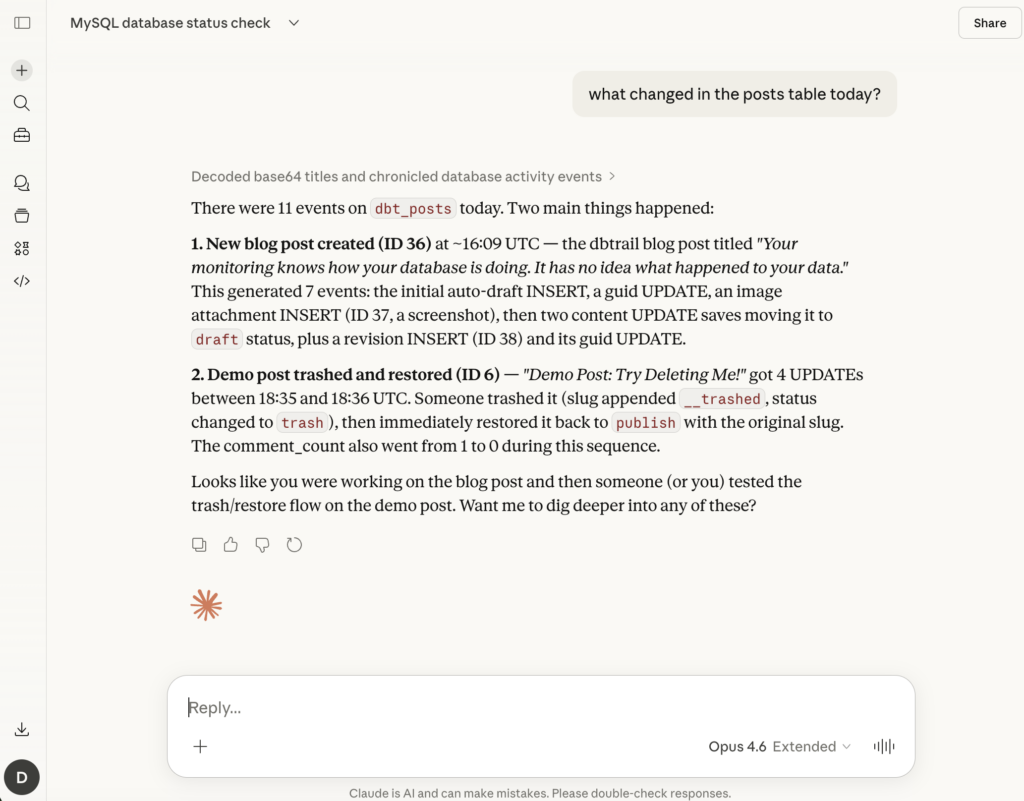
- “What changed in the users table after yesterday’s deploy?”
- “Who deleted those three rows from orders?”
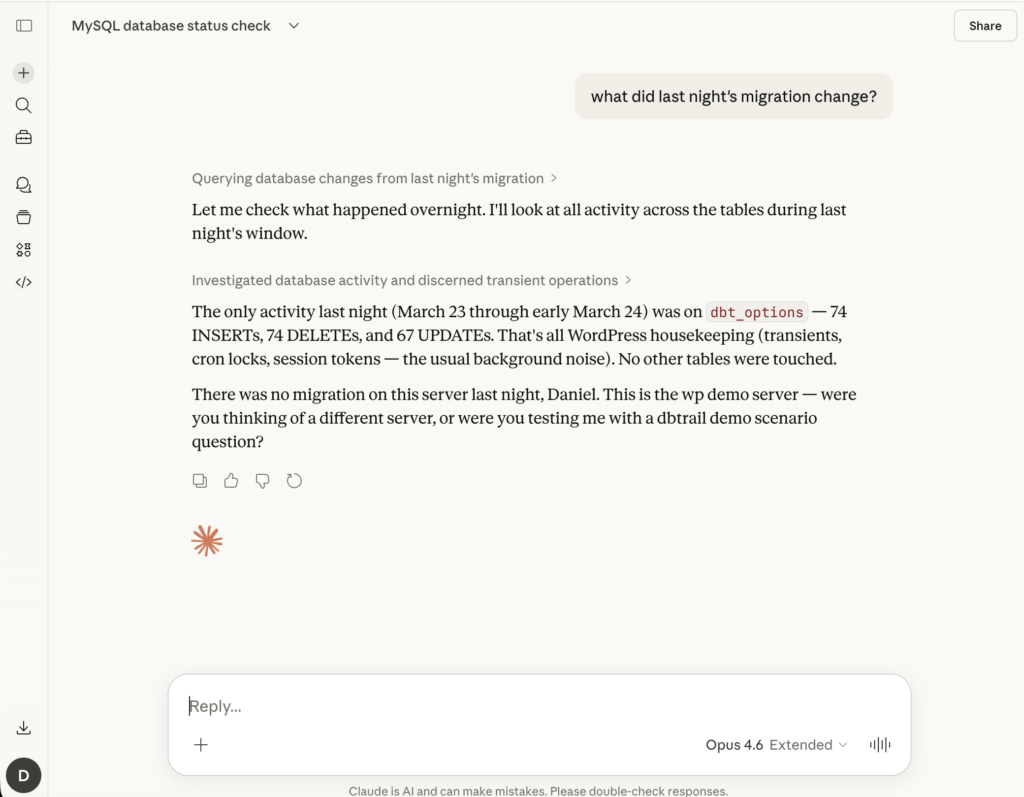
- “That migration was supposed to update pricing. Did it touch anything else?”
- “When exactly did this customer’s status change to cancelled?”
If you’ve been doing this for a while, you know the drill. You go to the binlogs. You fire up mysqlbinlog with some combination of --start-datetime, --stop-datetime, --database, and then pipe it through grep and hope for the best. Or maybe you’ve got a cron job dumping binlog events to a file somewhere. Or maybe you just don’t have an answer and you tell support “we’ll look into it.”
Monitoring is not observability (for data)
There’s been a big push in the industry to move from monitoring to observability. Traces, logs, metrics, the three pillars, all of that. And it’s real progress for understanding application behavior.
But nobody applied that same thinking to the data layer.
Your APM tool can trace a request through five microservices. Datadog, Grafana, PMM, CloudWatch — they’ll show you QPS, latency percentiles, lock waits, and replication health. Your logging pipeline can show you every HTTP request that hit the server. But when it comes to the actual database rows that those requests modified? Silence.
The irony is that the information exists. MySQL has been writing a complete record of every data change since… forever. It’s called the binary log. Every INSERT, UPDATE, and DELETE is there, with full row images if you’re using binlog_format=ROW (which you should be).
The problem is that nobody made it accessible.
mysqlbinlog is a great tool if you know exactly what you’re looking for, you know exactly when it happened, and you enjoy reading base64-encoded row events. For everyone else, the binlog might as well not exist.
What “data observability” actually looks like
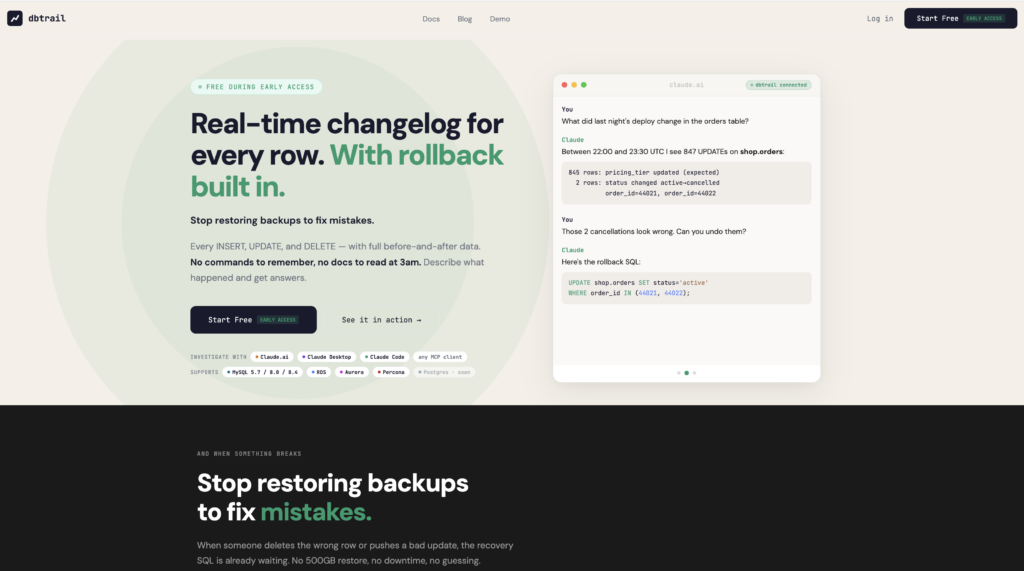
Imagine you could just ask: “What changed in the customers table between 2pm and 4pm?” and get back a table with timestamps, operation types, and full before-and-after row data. In seconds.
Not a Datadog graph showing INSERT/UPDATE/DELETE rates over time. The actual rows. The actual values. Before and after.
That changes things. Suddenly:
- Post-deploy verification goes from “let’s hope it worked” to “let’s check exactly what changed.” You can compare what the migration was supposed to touch versus what it actually touched.
- Support questions get answered in seconds instead of “we’ll look into it.” Someone asks about a customer’s account? You pull up the change history for that row.
- Incident investigation starts with facts instead of guesses. You don’t need to restore a backup to figure out what happened. The data is already there, indexed and searchable.
- Compliance and audit stops being a retroactive scramble. The audit trail is continuous and automatic.
And here’s the part that surprised us the most when building this: you use it every day. Not just during incidents. Every day. After every deploy. Every time support asks a question. Every time a developer says “that’s weird, the data doesn’t look right.”
It’s not an extinguisher you hang on the wall and hope you never need. It’s more like git log. You check it constantly, and the fact that git revert exists gives you peace of mind, but log is what you actually use.
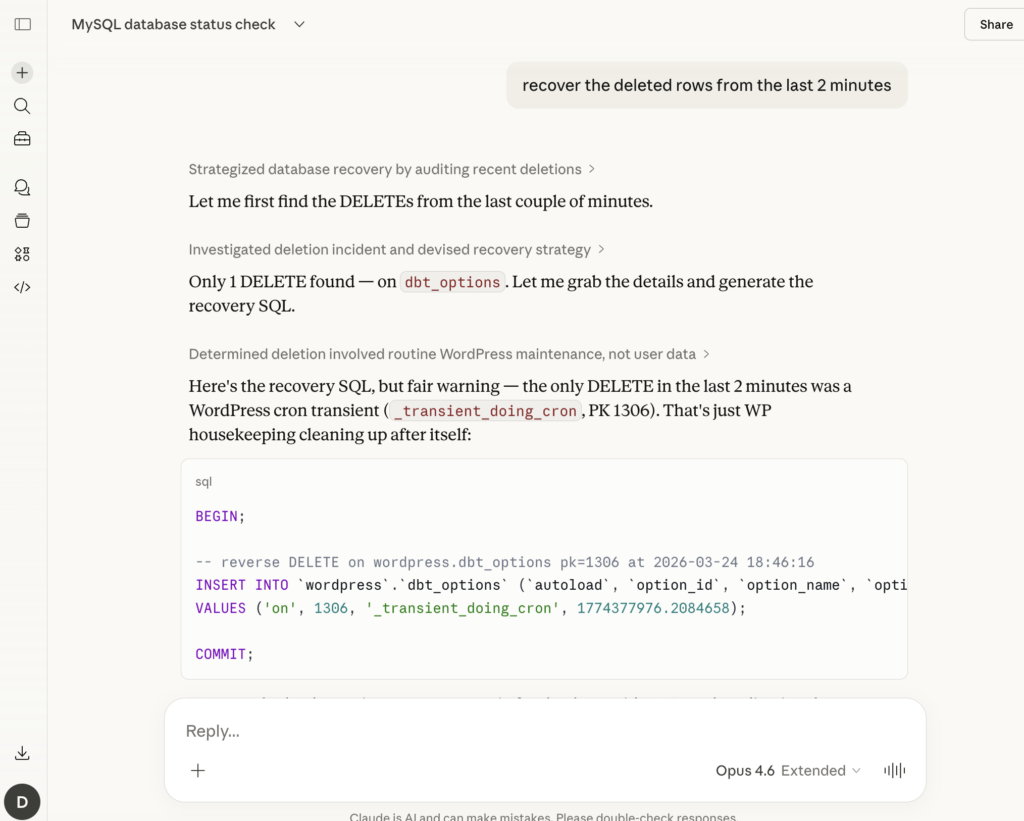
The recovery angle
And yeah, when something does break, having the full row history means you can generate recovery SQL automatically. Someone runs a bad DELETE? You don’t need to restore a 500GB backup to get those 3 rows back. The before-images are right there. Generate an INSERT, review it, run it. Done.
But that’s the safety net, not the reason you show up every morning.
Why now?
Two things changed that make this practical today.
First, MCP (Model Context Protocol) made it possible to interact with data tools through natural language. Instead of memorizing mysqlbinlog flags or writing complex queries, you can literally say “show me what changed in the orders table after the deploy” and get a structured answer. The interface became conversational.
Second, cloud infrastructure made it viable to index binlog events cheaply and store them long-term. Binlog data is write-once, append-only. It compresses well and it’s perfect for columnar storage.
The combination means you can have a searchable, queryable history of every row-level change in your database, accessible through plain language, running continuously with zero overhead on your production server.
This is the idea behind dbtrail. We read your MySQL binlogs, index every change with full before-and-after row data, and let you search and recover through Claude or any MCP client.
It’s free during early access. No credit card. If you’ve ever spent 2 hours restoring a backup to find 3 deleted rows, you know why we built this.