Rate Limiting (Throttle) for MySQL with ProxySQL and Bintrail

Back in 2020 I wrote about rate limiting writes to MySQL with ProxySQL. The main idea is still valid, but two things changed enough to write it again. ProxySQL moved on, and the global delay variable that the old post used is now the rough way to do it. We also have a better way to answer a question the original post did not really solve: not only if we should throttle, but which writes to throttle.
This version rewrites everything in Python, targets ProxySQL 3.0.x (the current Stable tier) and MySQL 8.4 LTS, and adds binlog change information so the throttle goes after the table that is really causing the replica lag, instead of guessing.
What a throttle is
In simple words: we hold the queries for a short time so the replicas can catch up. A throttle never stops a write, it only delays it. You pay a bit of write latency and you get a replica that stays close to the primary, which is usually what you want during a traffic spike.
There are several ways to do this. One popular tool is Freno. But ProxySQL can also do it by itself, and that is what we are going to build.
Flow control without the cluster
A throttle and flow control are the same idea: slow the writes so the appliers can catch up. What differs is where the brake lives and how hard it pulls.
Galera / PXC does it inside the replication protocol. When a node’s receive queue grows past gcs.fc_limit, that node tells the whole cluster to pause replication until it drains the queue. It is a hard, global stop: no node is allowed to get more than a queue’s worth of write-sets ahead of the slowest one. You get a tight bound on lag, and you pay for it with a cluster that stalls together when one node is slow.
Group Replication (InnoDB Cluster) lives in the protocol too, but it is softer. In the default QUOTA mode, when the certifier or applier queue on a member crosses a threshold, the group computes a write quota in commits per period and holds the writers to it. It does not stop the writes, it meters them. That is worth saying clearly, because it is close to what we are about to build: a write throttle that reacts to how far the appliers are behind.
That is the whole point. What Group Replication does natively with a quota, you can approximate on plain asynchronous replication with a delay on the proxy. Same shape: watch how far the appliers are behind, slow the writes, let them catch up, release. Different signal and different enforcement point: GR measures queue depth and meters at commit time, we measure Seconds_Behind_Source and delay at the proxy. It is looser and it is reactive, but it does not ask you to migrate to either cluster to get flow-control-like back-pressure.
So set the expectation honestly. This does not give you zero lag, and neither does a cluster: Galera and GR also apply asynchronously on the non-origin nodes, which is why GR ships consistency levels. What it gives you is clamped spikes and a low average. The replica stays close to the primary during a burst instead of falling far behind and recovering slowly afterward.
Two mechanisms and why we use the per-rule one
The original post started with mysql-default_query_delay, a global variable that delays every query that passes through ProxySQL. It still exists and still works, it is not deprecated. But it is global by definition: it cannot tell one table from another, and that difference is the whole point of this article.
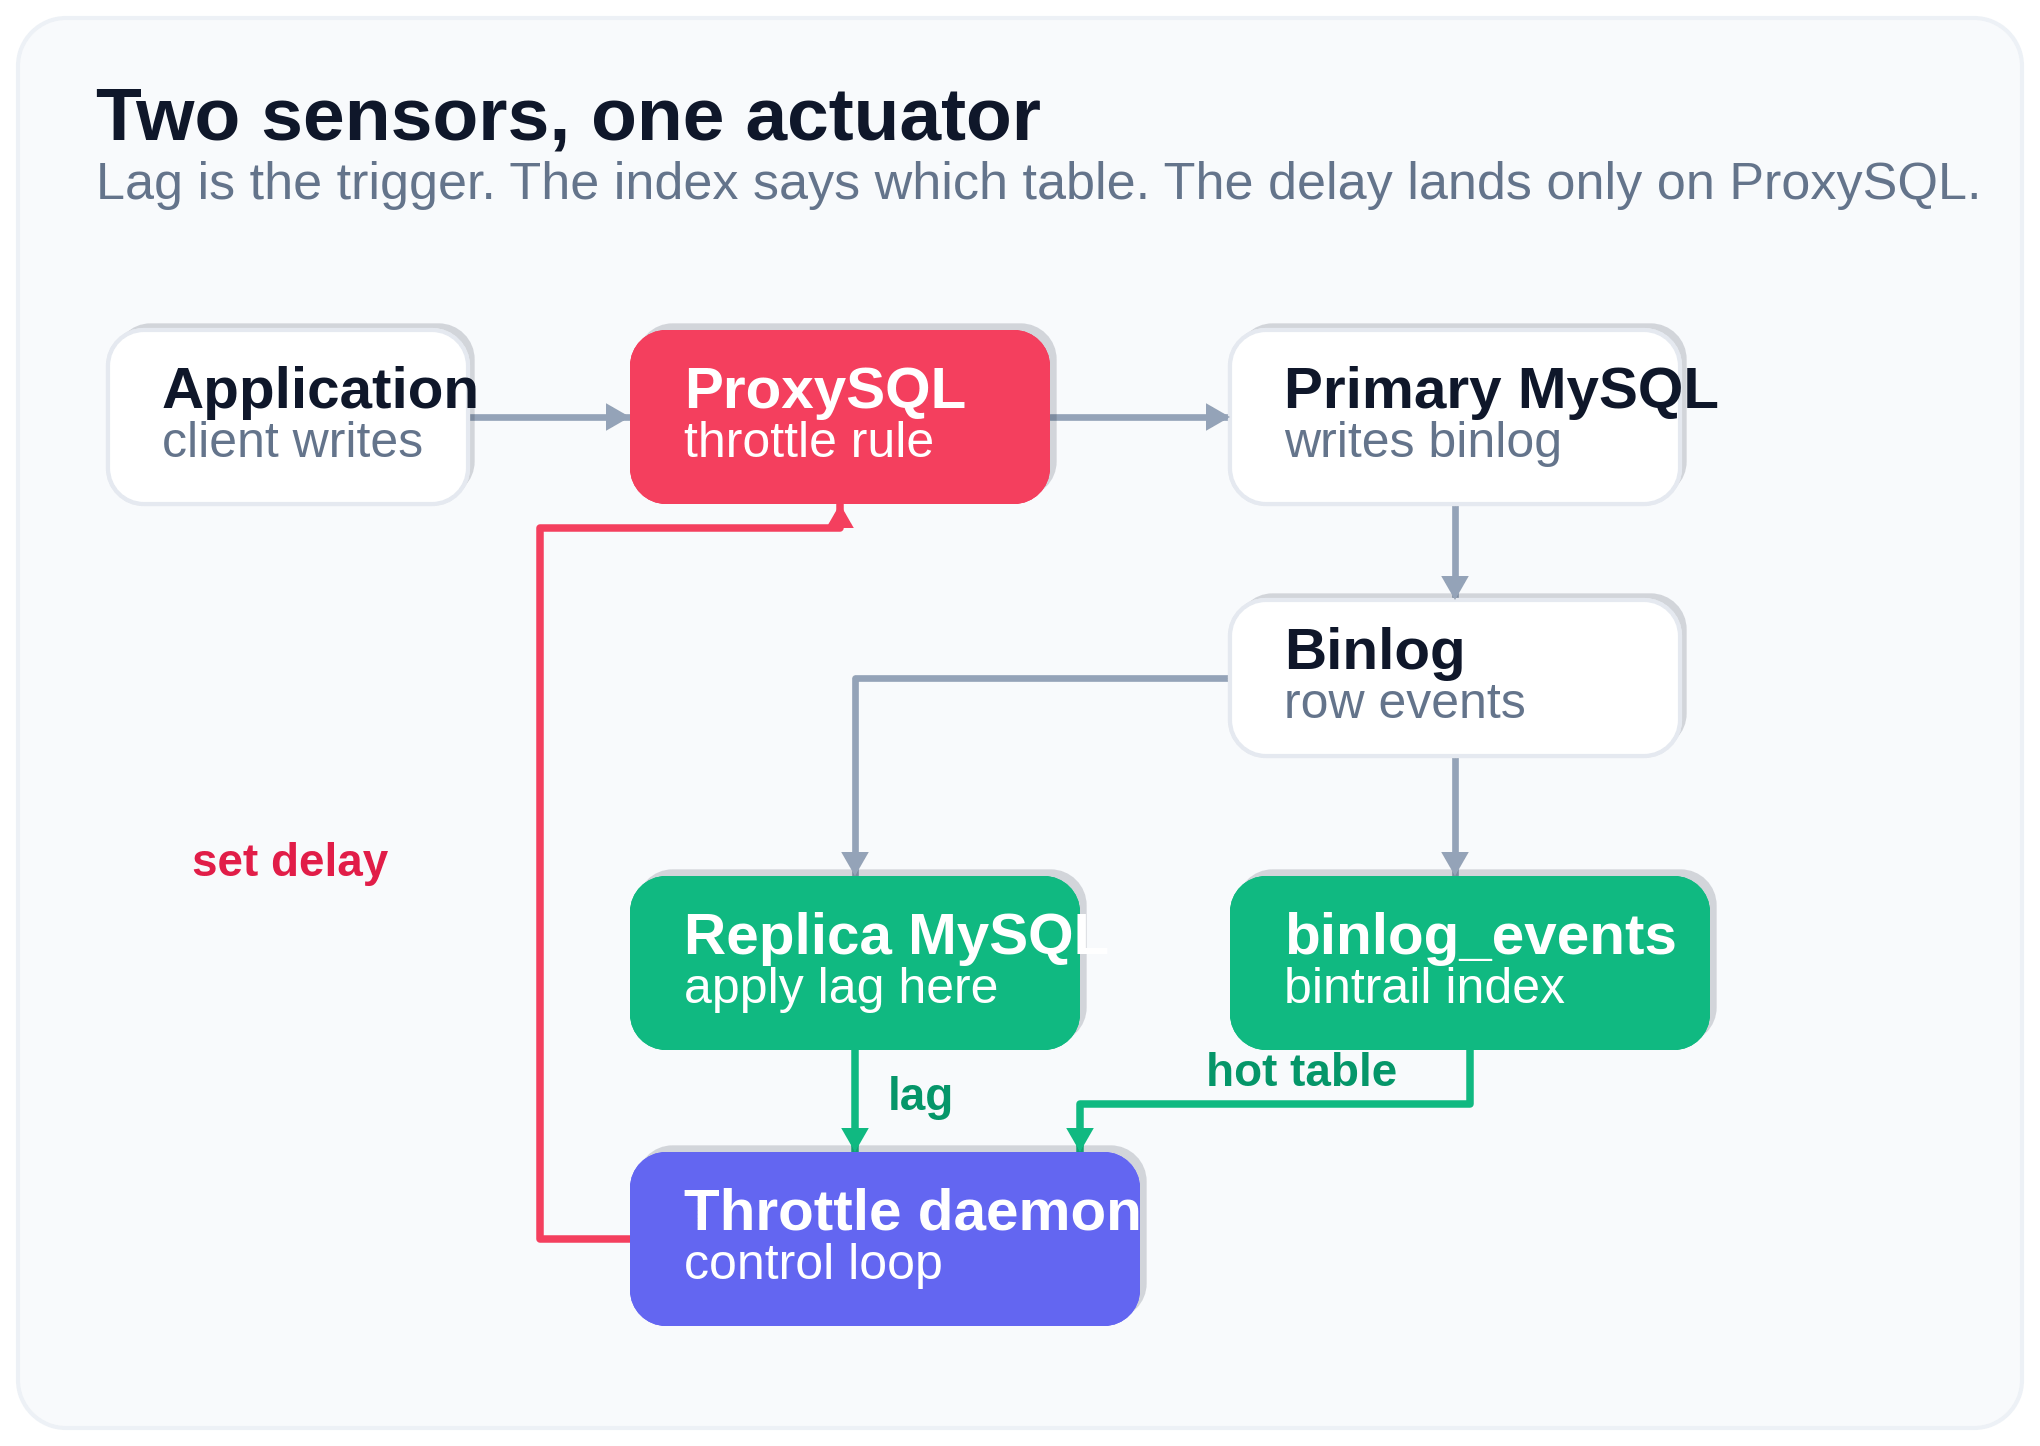
The more precise mechanism is the per-rule delay column in mysql_query_rules: the number of milliseconds to delay the execution of any query that matches the rule. It is meant for throttling and QoS. We use it for two reasons. First, it is precise, it only affects the queries that the rule matches, so we can target one single table. Second, when a rule sets delay, the global mysql-default_query_delay is ignored for that query, so the two do not fight each other.
The trigger: replica lag in MySQL 8.4
Reading it from Python with PyMySQL (the lightest option, no C extension to compile) looks like this:
def get_replica_lag(conn):
    """Return Seconds_Behind_Source as an int, or None when replication is
    not reporting a value. NULL is NOT zero."""
    with conn.cursor() as cur:
        cur.execute("SHOW REPLICA STATUS")   # 8.0.22+ / 8.4 wording
        row = cur.fetchone()
    if not row:
        return None
    val = row.get("Seconds_Behind_Source")
    return int(val) if val is not None else None
Two details matter here, because both can leave a naive throttle stuck. Seconds_Behind_Source is NULL when replication is not really applying, for example the SQL thread is stopped, or the relay log is empty while the receiver thread is down. That means unknown, not caught up, so we return None and handle that case on purpose. Also, the value compares the SQL (applier) thread against the IO (receiver) thread, so on a slow network it is only an approximation. For a throttle that reacts in seconds it is good enough, just do not read it as an exact transaction-level lag.
Letting the binlog answer
So we need to know, cheaply and often, which table is producing the most binlog change right now. The binlog already has this information, we only need it in a form we can query.
bintrail does that. Its stream command tails the binlog and indexes every row event into a MySQL table, binlog_events, with the schema name, the table name, the event type and the event timestamp. Once that table exists, “which table is hottest” is one GROUP BY:
SELECT schema_name, table_name, COUNT(*) AS c
FROM binlog_events
WHERE event_timestamp >= UTC_TIMESTAMP() - INTERVAL 60 SECOND
GROUP BY schema_name, table_name
ORDER BY c DESC
LIMIT 1;
The index is local and the query is cheap, so the answer is current within seconds, fast enough for a control loop that reacts in seconds.
Three things to be careful about.
First, this returns absolute counts, not a rate. For “which table is hottest” the ranking is all we need, so the raw count is fine; if you want changes per second, divide by your window.
Second, pin the index session to UTC. bintrail stores the binlog event timestamps in UTC, so comparing against UTC_TIMESTAMP() keeps the window correct no matter what timezone the index server runs in. The script does SET time_zone = '+00:00' on connect.
Third, do not turn a query error into “no hot table”. If the index is down or the connection blips, the query raises, and the caller keeps the previous target instead of reading the error as “nothing is hot”. An error that silently becomes “nothing is hot” would stop the throttle while the replica keeps lagging, which is the opposite of what we want.
The lookup is a network round trip to the index, so we do not call it in a tight loop. We poll the replica lag often, because that is cheap and local, and we only re-query the hot table every few seconds.
Applying the delay to the right rule
Now we turn “schema.table is hot” into a ProxySQL action. We keep one dedicated throttle rule and set its delay. There are two mistakes the obvious version makes:
- Do not throttle reads. A plain table-name match also catches
SELECT, and reads do not produce binlog, so delaying them only hurts queries that are not causing the lag. We anchor the match to
a write verb. - Do not ignore the schema. If you match only the table name, a table with the same name in another schema gets throttled too. We put the schema in the pattern.
match_digest matches the normalized query digest (the literal values are replaced), using a regular expression. ProxySQL supports both PCRE and RE2 engines, and PCRE is the default since v1.4.0. The schema part is optional in the pattern because many applications send unqualified writes against their default database. The price is that an unqualified write to a same-named table in another schema can still match. If you need stricter isolation, use match_pattern against the raw query.
One ordering detail. ProxySQL evaluates the rules in ascending rule_id, and a rule with apply=1 stops the evaluation for that query. So the throttle rule has to come before any apply=1 routing rule, or your routing rules have to use apply=0, which is how the statement-type setup in the original post was configured. Choose a rule_id with that in mind. And check stats_mysql_query_rules.hits to confirm that the rule is matching real traffic, because a rule that matches nothing throttles nothing while it looks like it is working. That hits counter is eventually consistent, it lags the live count by about one query, so read it over a few seconds and not query by query.
One deployment note: the script talks to the ProxySQL admin interface (port 6032). On ProxySQL 3.0 the default admin account only accepts connections from the ProxySQL host itself, so either run the script on that host, or add a second non-local admin credential (admin_credentials="admin:admin;radmin:radmin") and point the script to that one.
Why not throttle the SELECTs? They are most of the traffic
This is the normal question. On almost any real database the reads are much more than the writes, so throttling reads would have the biggest effect. Is that not where the leverage is?
It is the biggest effect on proxy throughput, and no effect at all on what we are fixing. The trigger is the replica apply lag, and that lag depends only on write volume. Reads never go into the binlog, the replica never receives them, and the replica SQL thread never replays them. Throttling reads would slow down the 90% of traffic that has nothing to do with the lag, and the lag would stay the same.
You do not have to trust me. On a primary and replica pair, watch the binlog position and the number of replicated transactions while you send traffic through ProxySQL:
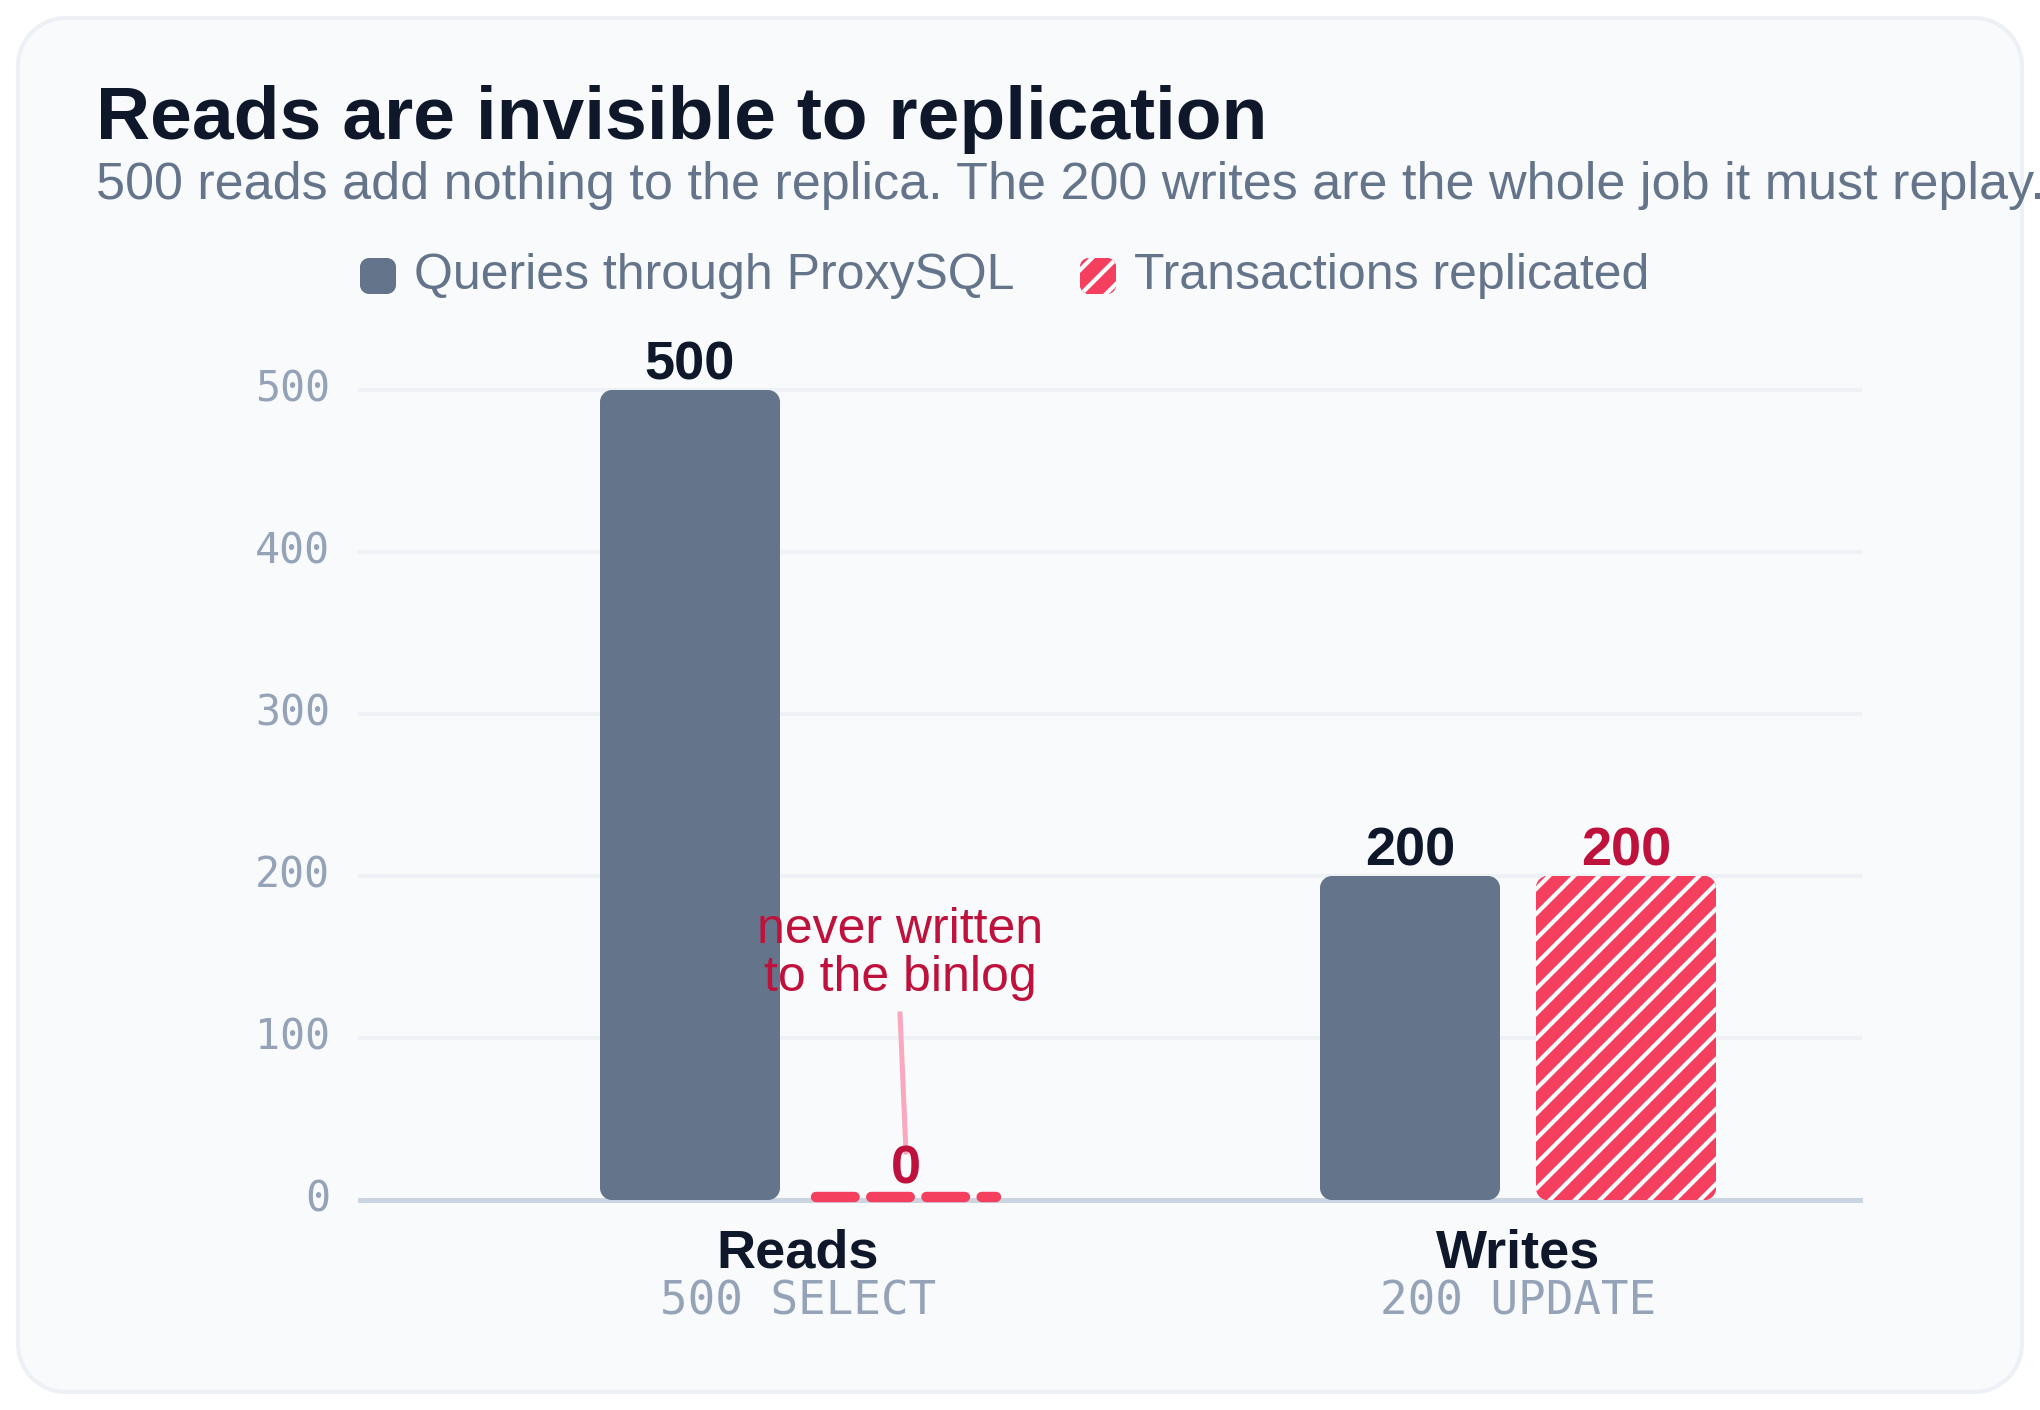
Five hundred reads add nothing to the replication stream. Two hundred writes are the whole work the replica has to apply. The reads are not slow replication, they are invisible to it.
This is also why a binlog signal is the right one and the hit-counter is not. Because the reads dominate, any counter based on query frequency is full of SELECTs and points you to the wrong rule. The binlog_events index records only writes, so a GROUP BY over it cannot be confused by read volume. The fact that most traffic is reads is the reason to use a write-only signal, not a reason against it.
There is one case where reads do matter: a primary that is CPU or IO bound because of read load. But that is a different problem with a different solution, read/write splitting, and a write-volume tool is not the right one for it. For the replica lag, the reads are negligible.
The control loop
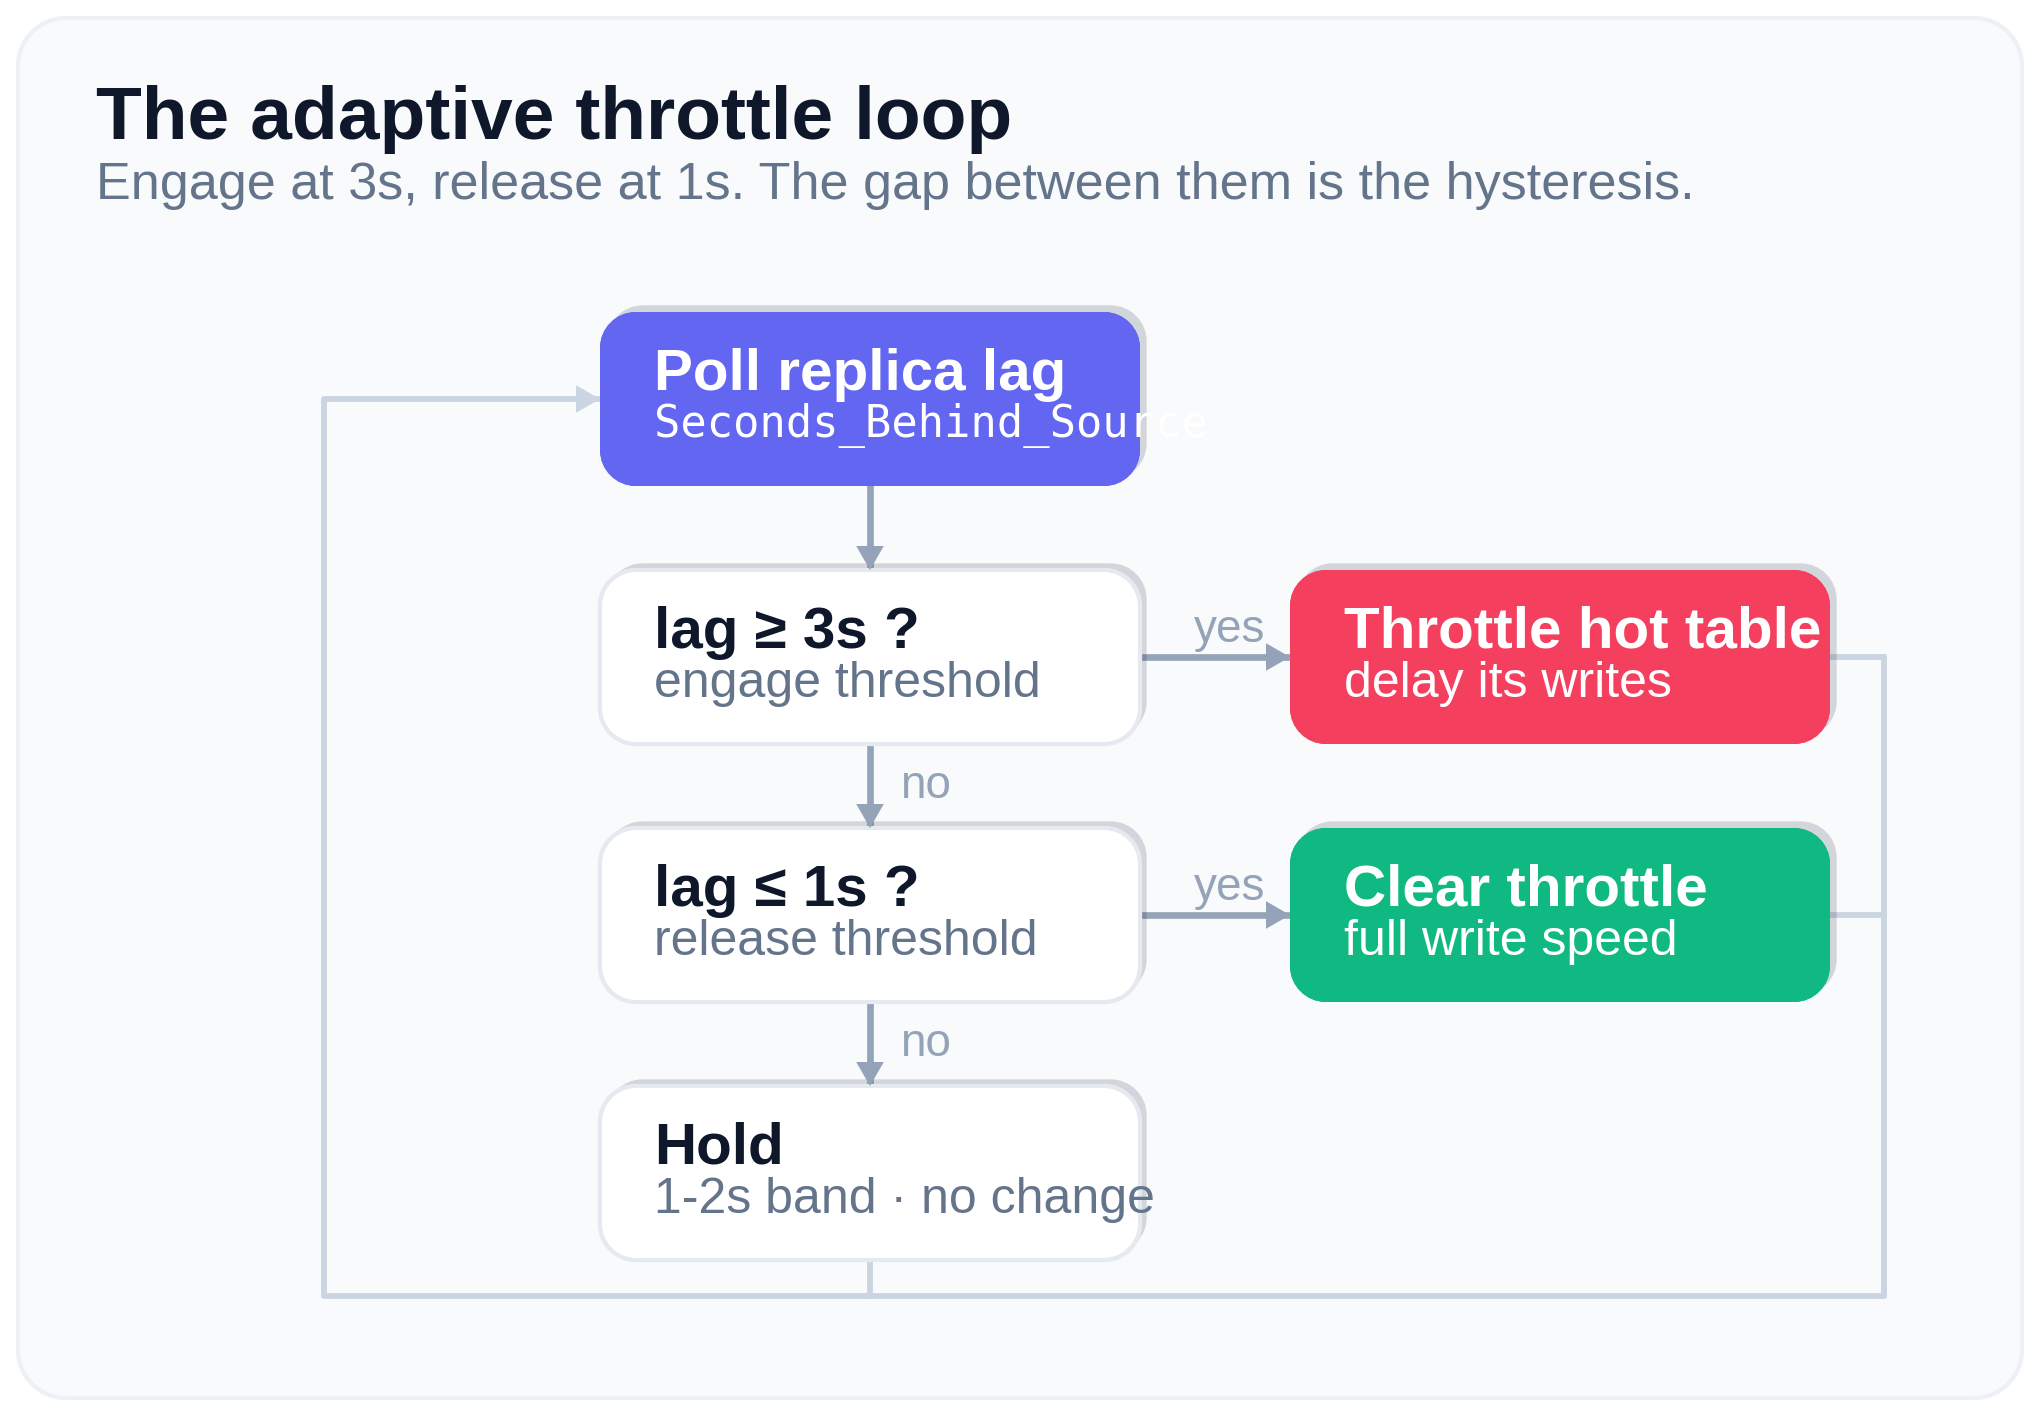
The shape is the same as in 2020: watch the lag, apply the delay when it grows, remove it when the replica catches up. What changes is the diagnosis step, plus three robustness points that the bash version could ignore but a long running Python daemon cannot:
- Use hysteresis, not exact zero. Engage at
lag >= 3, release atlag <= 1. If you release only at exactly0, the throttle stays forever on a busy replica that sits at 1-2 seconds. - A flaky dependency must not kill the daemon. Each iteration is wrapped, so an index timeout or a ProxySQL problem is logged and retried, never fatal. A crash would leave the throttle active with nobody watching.
- Do not reload rules that did not change.
LOAD MYSQL QUERY RULES TO RUNTIMErebuilds the whole active rule set under a lock, so we only call it when the hot table really changes.
And the signal handler that removes the throttle on exit, the equivalent of the trap in the bash version, with one rule: never print “cleared” if the clear actually failed. A false success is worse than a clear failure, because the operator leaves thinking the writes are at full speed when they are still delayed.
The complete script that you can run is in https://github.com/dbtrail/bintrail/blob/main/scripts/adaptive_throttle.py
It watches a list of replicas and drives the decision off the worst lag, exactly as the next section describes.
One throttle, all the replicas of that primary
A note on scope, because it is easy to read this as per-replica and that is only half true. The delay is attached to the write statements, and writes go to the primary. Slowing them slows the primary’s binlog, and every replica that reads that binlog catches up at once. One throttle rule covers the whole fan-out under that primary.
The boundary is the replication topology, not the ProxySQL hostgroup. A replica sitting in a different reader hostgroup still benefits, as long as it replicates from the same primary, because the relief comes from slowing the primary and not from how reads are routed. A replica hanging off a different primary does not benefit, because its writes never matched the rule.
Detection is the per-replica half. The loop reads Seconds_Behind_Source from the replica you point it at, so it reacts to that replica’s lag. If several replicas share the primary and the hardware is uneven, watch the worst one, or read all of them and take the max. The trigger is per-replica by choice, the action is cluster-wide by construction.
Beyond lag
The lag is only one possible trigger. Replace get_replica_lag with anything you can read from a status variable: Threads_running for contention, the InnoDB checkpoint age for IO pressure. The throttle mechanism does not care what triggered it.
The new freedom is on the other side of the loop. Because the binlog is indexed and queryable, you can split the cause further by adding event_type to the same GROUP BY. The throttle can be as specific as “delay the UPDATEs to this one table” instead of “delay all the writes and hope”.
With the binlog indexed and queryable, the throttle stops guessing and starts aiming.